Raw data: image alignment and overscan#
ZTF raw data fits.fz files contains 8 entries: 4 data (the 4 read-out channel that will become the 4 quadrants) and 4 overscan (one per read-out channel).
the ztfimg.RawCCD object is made to handle these data. You can quickly access the data as a whole (full ccd) or the individual quadrants. The data management (overscan and non-linearity corrections) are made at the quadrant level using the (ztfimg.RawQuadrant). A ztfimg.RawCCD object is basically a collection of ztfimg.RawQuadrant.
RawCCD#
load a RawCCD#
the easiest and most natural way to load a rawccd object is to use the from_filename class method (see other from_ methods).
[1]:
import ztfimg
[2]:
# This is the exact full path.
filename = "/Users/rigault/data/ztf/raw/2020/0401/152477/ztf_20200401152477_000517_zg_c06_o.fits.fz"
basename = "ztf_20200401152477_000517_zg_c06_o.fits.fz" # see as_path=False later on.
[3]:
rawimg = ztfimg.RawCCD.from_filename(filename) # providing the exact path
If the image is stored within a normal ztfquery structure, you can simply provide the basename, ztfquery will know how to get back to the exact path. Set as_path=False is you use that. Remark that this option also enables you to download the image if needed be.
[4]:
# providing the basename, will download the file if needed.
rawimg = ztfimg.RawCCD.from_filename(basename, as_path=False)
display the data#
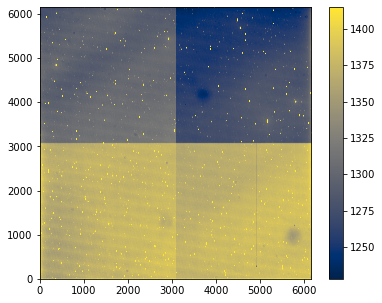
The 4 readout channel each have its gain etc, so you will see jumps in the image. The structure of the ztf ccd is as follows:
q2 | q1
—-------
q3 | q4
[5]:
_ = rawimg.show()
get the data#
The get_data method will loop over the quadrant to get there data, reorganise them to get a continous sky.
[6]:
data = rawimg.get_data()
you can request the overscan and nonlinearity correction (False by default)
[7]:
dataclean = rawimg.get_data(corr_overscan=True, corr_nl=True)
dataclean
[7]:
array([[1316.8003 , 1739.455  , 1724.4984 , ..., 1710.6013 , 1723.4324 ,
        1296.723  ],
       [ 829.09106, 1221.8071 , 1256.4342 , ..., 1245.3431 , 1250.7899 ,
         780.8468 ],
       [ 841.2976 , 1271.9949 , 1269.2173 , ..., 1271.1183 , 1218.749  ,
         836.15924],
       ...,
       [ 748.7309 , 1142.6038 , 1144.1011 , ..., 1266.0874 , 1210.1501 ,
         800.2689 ],
       [ 731.2822 , 1176.598  , 1200.5334 , ..., 1313.9523 , 1274.9293 ,
         774.8022 ],
       [ 844.0214 , 1282.292  , 1256.212  , ..., 1356.0068 , 1380.6293 ,
         923.2839 ]], dtype=float32)
get the individual quadrant from rawccd#
Say you want to look into the details of the data, you need to access the quadrant (read-out channel). Use the get_quadrant() method to do so. This will return a RawQuadrant object
[8]:
q2 = rawimg.get_quadrant(2) # qid \in [1,2,3,4]
RawQuadrant#
data, as they are stored, are in self.data. get_data re-order them by default and enables the overscan and non-linearity (nl) corrections
Data and overscan#
[9]:
data_as_stored = q2.data
data_as_stored
[9]:
array([[1284.2227, 1288.1523, 1264.0431, ..., 1256.212 , 1282.292 ,
         844.0214],
       [1215.5084, 1204.0764, 1160.0203, ..., 1200.5334, 1176.598 ,
         731.2822],
       [1155.6116, 1151.7378, 1123.716 , ..., 1144.1011, 1142.6038,
         748.7309],
       ...,
       [1182.5192, 1149.1016, 1212.0585, ..., 1207.5201, 1181.7251,
         817.2543],
       [1188.1101, 1194.3397, 1177.6622, ..., 1196.2329, 1176.3292,
         797.8119],
       [1213.8746, 1246.258 , 1210.3801, ..., 1189.878 , 1214.299 ,
         785.7456]], dtype=float32)
[10]:
data = q2.get_data()
You have the same for the overscan
[11]:
overscan_as_stored = q2.overscan
print(overscan_as_stored.shape)
overscan_as_stored
(3080, 30)
[11]:
array([[119.08502 , 121.61354 , 119.66475 , ..., 166.4988  , 191.78949 ,
        249.46776 ],
       [118.2928  , 120.79559 , 120.288284, ..., 164.52103 , 185.65916 ,
        261.8302  ],
       [119.85344 , 122.46118 , 119.71309 , ..., 163.46179 , 188.96735 ,
        256.8821  ],
       ...,
       [124.43179 , 121.76079 , 121.40225 , ..., 163.66132 , 192.2597  ,
        255.02402 ],
       [122.37653 , 125.146835, 123.440796, ..., 165.20505 , 192.26529 ,
        253.542   ],
       [124.490456, 120.93608 , 123.268524, ..., 163.40166 , 187.65167 ,
        248.36089 ]], dtype=float32)
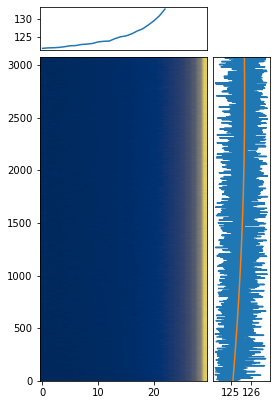
and get_overscan() enables you to access the overscan model, data (used for the model) or raw (as stored)
[12]:
overdata_used = q2.get_overscan("data")
print(overdata_used.shape) # only using the [5,25] rows by default discarding first and last for the modelling
overdata_used
(3080, 20)
[12]:
array([[121.945984, 121.243515, 120.4331  , ..., 127.06198 , 135.78477 ,
        137.11914 ],
       [121.65073 , 117.55092 , 118.717606, ..., 127.69003 , 133.99309 ,
        136.32646 ],
       [119.03253 , 122.38481 , 120.41713 , ..., 135.54243 , 131.90317 ,
        138.92291 ],
       ...,
       [120.62455 , 121.773964, 121.848076, ..., 131.34047 , 140.71294 ,
        138.56656 ],
       [124.303474, 121.52228 , 123.996826, ..., 131.44818 , 134.5946  ,
        142.8254  ],
       [121.46734 , 120.97294 , 123.60628 , ..., 130.08493 , 134.55086 ,
        136.753   ]], dtype=float32)
[13]:
q2.get_overscan("model")
[13]:
array([125.11133809, 125.11176778, 125.11219731, ..., 125.67612077,
       125.67605802, 125.67599511])
Plotting#
[14]:
# Plot the data
_ = q2.show()

[15]:
# Plot the overscan
_ = q2.show_overscan()
Get last data and first overscan#
[16]:
last_data, first_overscan = q2.get_lastdata_firstoverscan()
first_overscan
[16]:
array([249.46776, 261.8302 , 256.8821 , ..., 255.02402, 253.542  ,
       248.36089], dtype=float32)
or the n-last / n-first while correcting both the data and the overscan for the overscan model
[17]:
last_data, first_overscan = q2.get_lastdata_firstoverscan(n=2, corr_overscan=True)
first_overscan
[17]:
array([[124.35642 ,  66.678154],
       [136.71843 ,  60.547398],
       [131.76991 ,  63.85515 ],
       ...,
       [129.3479  ,  66.58358 ],
       [127.86595 ,  66.58923 ],
       [122.68489 ,  61.975677]], dtype=float32)
Load RawQuadrant from filename#
RawQuadrant also have a from_filename method that inputs rawccd filename, simply provide the quadrant you want to load
[18]:
q3 = ztfimg.RawQuadrant.from_filename(basename, as_path=False, qid=3)
[19]:
q3.meta
[19]:
year                     2020
month                      04
day                        01
filefracday    20200401152477
fracday                152477
paddedfield            000517
field                     517
ccdid                       6
filtercode                 zg
filterid                    1
kind                      raw
suffix              o.fits.fz
dtype: object
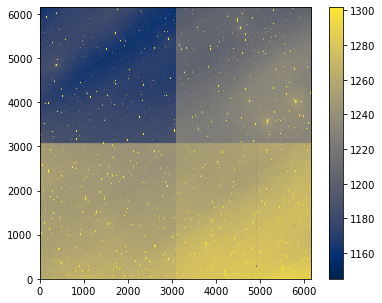
Access Science Image from Raw#
both RawCCD and RawQuadrant have ways to easily access their corresponding science image
[20]:
sciimg_q2 = q2.get_sciimage() # this will download it is necessary (both sciimg and mask)
[21]:
_ = sciimg_q2.show()

or at the ccd level
[22]:
sciimg_ccd = rawimg.get_sciimage(as_ccd=True) # set as_ccd=False to get a list of 4 quadrant sciimg
[23]:
_ = sciimg_ccd.show()
[ ]: